Last Wednesday, there was a Fed meeting, and Jay Powell said what many were expecting.
Instead, he said nothing, and this was precisely what many people were expecting.
As we told you on Wednesday, we believe three assets will perform well next year, and if that was not enough, Powell corroborated it.
Today we want to bring you one of the most important metrics to look out for in the medium to long term, which clearly corroborates the bullishness of the markets.
The 200-day average has been exceeded for the first time in the last six months. This generally means that we are in a bullish period. But this is something we already told you. Next year the FED will start printing money again, driving the markets back up.
Markets are tremendously correlated with monetary policies, and they are now being tightened. What does that imply? It is time to accumulate. Buying any of the three assets we told you about on Wednesday would be a good option.
No two crises are the same, but this one is far from similar to 2008. As we have told you many times, this recession is much more similar to the 1970s, and the following chart corroborates this.
In the mid-1970, inflation rose out of control and, like everything that grows fast, it came down in an accelerated fashion. The S&P 500 also saw a rise in inflation reflected, but there was a strong correlation between inflation and the fall of the S&P 500.
The expected recession
"The one that's coming." Everyone is talking about a recession, and we think there may be some downside in the markets, but next year will be much more bullish than bearish.
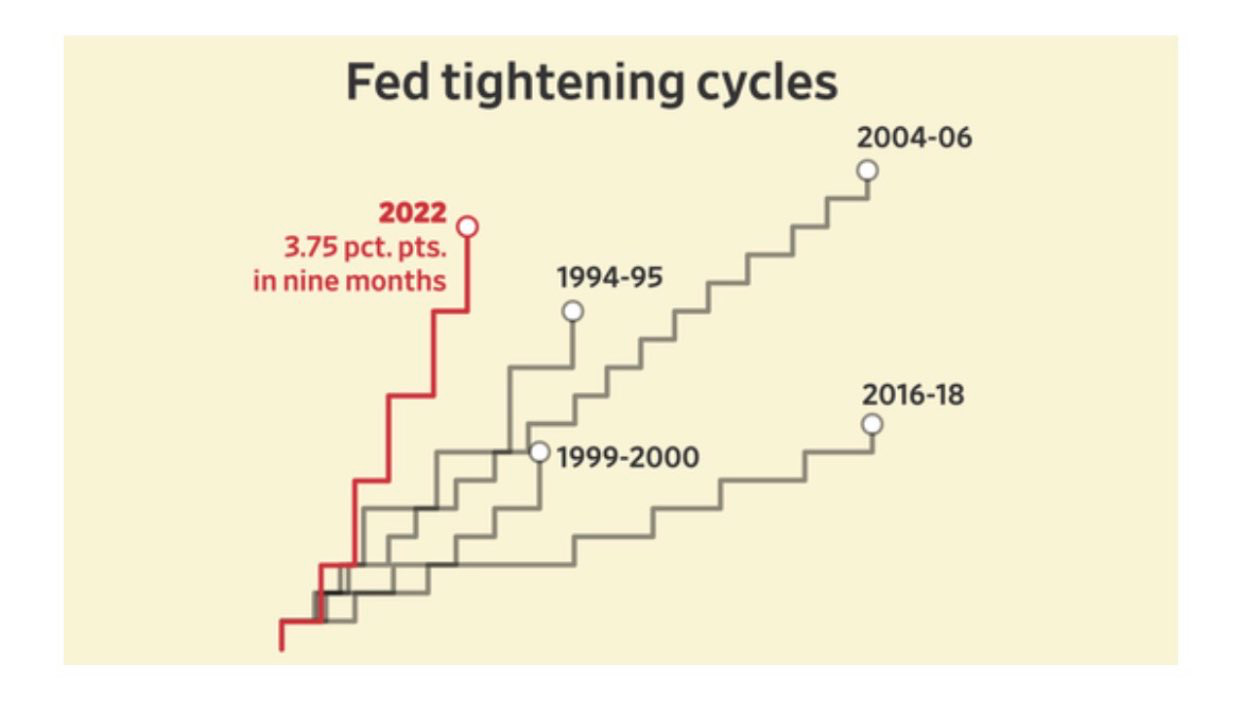
Of course, a recession is coming in Europe and probably also in the US. It is the most heralded recession in history, as interest rates have never been raised at a similar pace.
But bear markets in inflationary cycles do not end when the recession reaches its climax, as usual, but when inflation starts to improve because that generates better economic expectations.
But people are very wrong. When inflation goes down, just the opposite happens that happens when it goes up, and that is that it is very bullish for the markets.
In the chart above, when inflation starts to go down, look at what happens to the markets.
We already know that we have a somewhat leveraged position in our portfolio to be able to capture all the upside that, in our view, will happen between next year and 2024.
We knew that there would be quite a bit of movement in the markets this week, so we have benefited from that through our Covered Calls strategy, which has caused us to increase our annualized return.
Let's see what we bought in more detail:


