
What If Michael Burry Is Wrong?
Similarities and differences with the 1929 crisis, and several lessons that will make you sell your stocks.

The historic investor Michael J Burry has done it again. He has published an image that, in a way, reminds us of the current situation. The 1929 crisis was undoubtedly the worst we know of in the American economy. Markets plummeted by more than 70% and there were many years of poverty.
Many people comment on RRSS that we are on the way to a much more critical recession than the one we experienced that year. But is this true? Let's put things in context.
Gross Debt
In 1929, after the First World War, there was a very aggressive financial policy to alleviate all the economic consequences. This caused the public debt (both internal and external) to multiply x6.
 Total Public Debt / GDP Ratio
World War I
World War 2
US civil war
1810
1820
Dec31, 1789
2000
2000
Oct 1, 2021
75 %
50%
25%
0%
2020
1830
1825
1850
1860
1870
1880
1890
1900
1910
1920
1930
1940
1950
1950
1960
1970
1980
1990
2010")
To put things in context, it is true that today's debt is at record highs. However, this increase in debt as a percentage has been an increase of "only" x2 since 2010.
We are facing a rather similar paradigm, considering that the debt has multiplied by a smaller number of times, but the % of debt vs. GDP is much higher.
Inflation and House Index
What is true is that in the following years’ inflation shot up, we went from a purely deflationary environment to an inflationary scenario. This caused the housing price to decrease in the short term but multiplied several times its value in the medium-long term.
We have already argued on many occasions that today taking out a mortgage at 0-1%, knowing how much commodities are going to rise and how much a home will appreciate in value in the medium term, means gaining purchasing power for living in your home.
For example, a $400k mortgage for 30 years means a gain of between $17k-$20k in the long run. This does not consider the money you stop "losing" by renting.
Commodities
A few weeks ago, we told you that we did not know whether to reduce our exposure to gold and silver. After careful consideration and studying all possible scenarios, we now know that we will not. We want to remain exposed. Historically both metals have performed very well in recessions.
Imagine you invested all your money in 1929. Well, until 1955, you would not have recovered your initial investment. Twenty-six years at a loss! However, with gold or silver in your portfolio, you would at least not have lost purchasing power.

The yellow line is gold, the gray line is silver, and the blue and red lines are the Dow Jones and S&P500, respectively.
The following image is the most spectacular and, after much study, is the one that has convinced us to maintain our exposure.
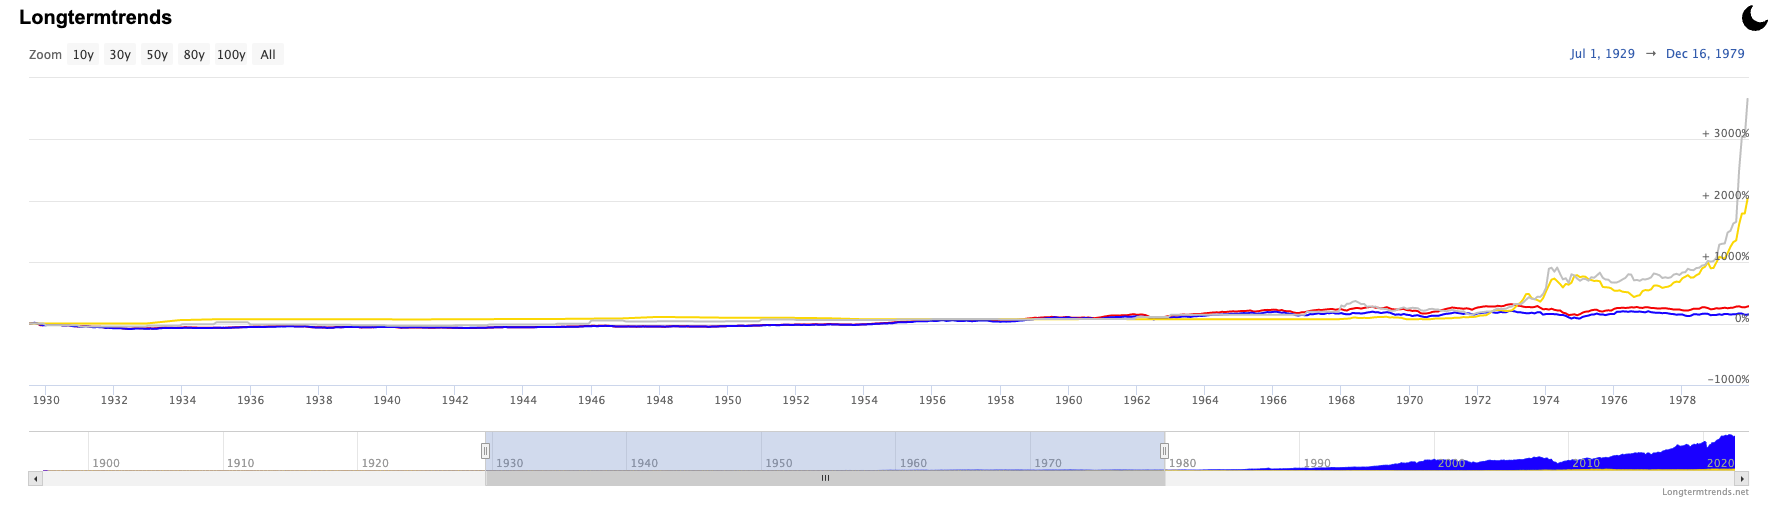
We always believe that stocks are a safe place, but we can see that from 1929 to 1980, they are not. Having a stock-only portfolio is very dangerous and even more so in today's environment.
