The Average Investor's Money Just Got Taken From Them
First capitulation in a bear market occurs
During the past week, we have seen an indicator become active that has not been seen since March 2020. It is the fear indicator, or as we call it, the "chicken" indicator.
When a recession occurs, the same thing always happens:
The institutions know information that the rest of the retail investors do not have. This makes them take their money out in massive forms. A clear example is what happened in Curve's liquidity pool with LUNA.
Retail investors generally do not notice these volume increases.
Everything starts to fall. At first glance, it looks like an assumable 5-10% drop.
After 10%, the average retail investor starts to get nervous.
When the falls exceed 15%, the worst investors are those who withdraw their money at a loss.
Some average investors are a little more risk-averse and hold on a little longer, but they do not have any strategy.
When the indices fall between 25-30%, generally, these losses are acquired by the institutions that bought in point 1. The rest of the investors who do not have a method exit with extreme losses.
This process transfers the money from the bad investors to the good investors, and once this process is complete, the market begins to recover.
During the past week, we reached that point.
The PPO shows us the percentage price oscillator (PPO) is a technical momentum indicator that shows the relationship between two moving averages in percentage terms. The moving averages are a 26-period and 12-period exponential moving average (EMA).
The PPO is used to compare asset performance and volatility, spot divergence that could lead to price reversals, generate trade signals, and help confirm trend direction.
Reliable Data
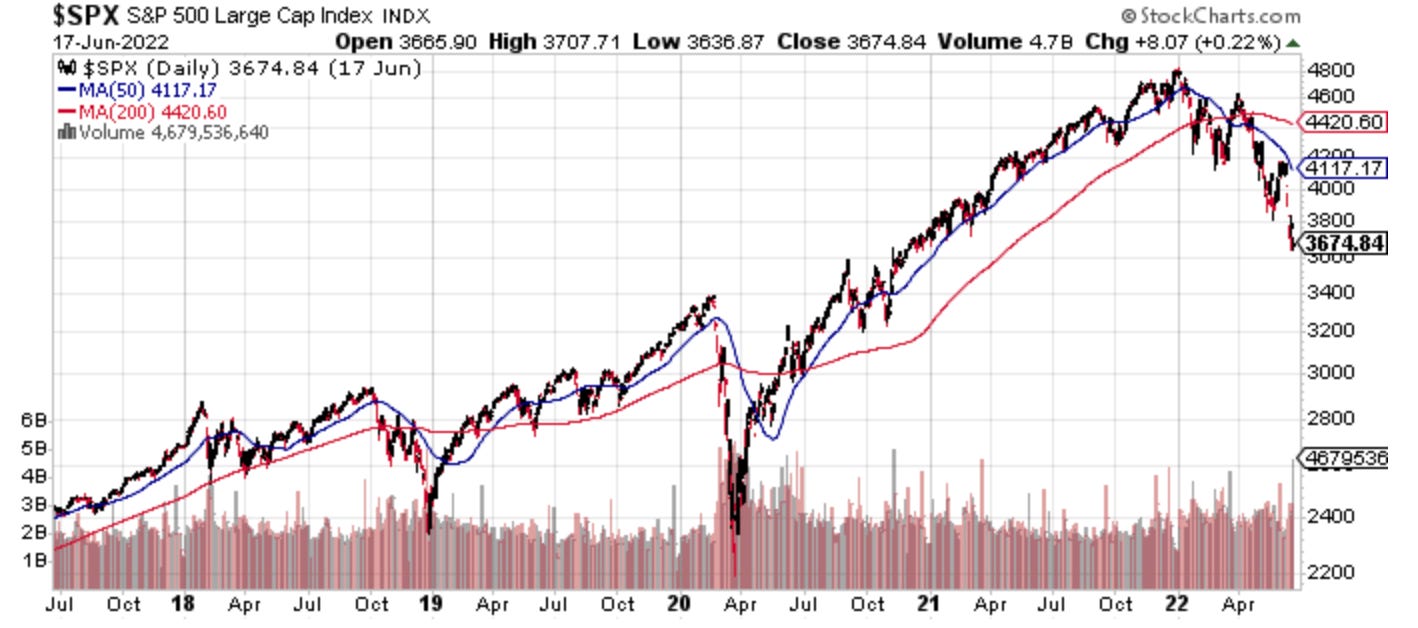
As you can see, over time, this indicator has always denoted a recovery. This does not mean that the main trend remains bearish. However, we see that at least these next few weeks, we can expect a minimum of air in the markets.
The divergence between the MA(50) and MA(200) has become very large in a very short time, this also helps our previous theory.


