This Indicator Has Been 100% Accurate Since 1940
Tend to be clearly bullish
For over two years now, we have been sharing two weekly newsletters, allowing thousands of subscribers to build an asymmetric portfolio. This approach ensures they can benefit and maintain over 50% in cash even during market downturns. We have achieved this by always being transparent, delivering truthful insights, and avoiding unrealistic promises of unattainable returns.
We recommended buying Bitcoin at $16k and accurately alerted subscribers to the market downturn that occurred in 2022, affecting the entire economy. Now, we want to offer you all this valuable analysis for free, without spending a single dollar. We won't make unrealistic promises of 200% returns for over $3,000 a year. All you need to do is refer our newsletter to others.
If you refer 5 people, you'll receive 1 month of free access.
For 10 referrals, you'll enjoy 3 months free,
and for 25 referrals, you'll have access for half a year free.
We're living in a unique period in history with aggressive interest rate hikes and debt surpassing 100% of GDP. You don't want to miss out on this.
Thank you once again for reading. This newsletter continues to thrive because of all of you. We have turned down over 20 sponsorship requests because they promote products that do not align with our beliefs. So, if you want to share this newsletter regardless of any rewards, we would also be very grateful.
Now, let's dive into this weekend's newsletter.
The market is always filled with pessimistic narratives, a trend that has persisted for decades and will continue in the years to come. Let's recall the extreme pessimism that arose when an agreement on the debt ceiling was not reached in the United States.
If the debt ceiling had not been raised, we would have witnessed the country's first default in history, which would have led to the United States losing its position as a global power and plunging us into a deep recession. It is understandable that this scenario caused concern.
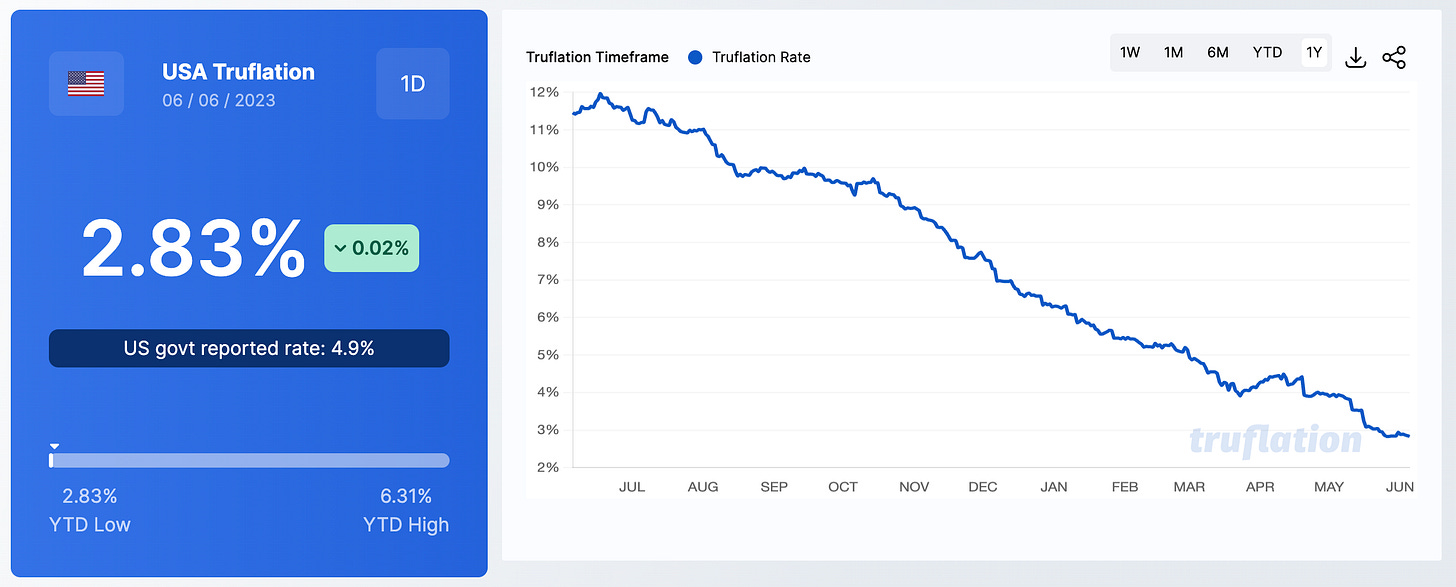
Currently, we face other issues that also generate unease, such as what is happening with Binance or the situation of inflation. In the future, new concerns will arise, such as the possibility of excessively low or even negative inflation. It is important to highlight that the real inflation in the United States, according to Truflation, is 2.83%, a much more realistic figure than the ones presented by the government.
One of the key indicators for evaluating any type of asset is the RSI (Relative Strength Index). Although I don't usually rely on technical indicators in my day-to-day activities, I firmly believe that limiting ourselves to a single type of investment closes us off to new opportunities and hinders our growth as investors and individuals.
The RSI indicates whether an index is overbought or oversold. Recently, the weekly RSI of the S&P 500 index entered an "overbought" condition after reaching a minimum in the last 18 months. Historically, when the market confirms its bullish trend, an initial overbought reading after a downtrend is common.
In fact, this latest signal activated last Friday is the eighteenth since 1949, and the last time the indicator failed was in that year when the market reached a new low after the signal. A graphical analysis by Mark Ungewitter shows all the events in which this indicator has been activated in the last century.
In total, there has been an 84% accuracy rate in terms of the continuation of the bullish trend. It is interesting to note that the 16% of errors occurred in four events during the 1930s and 1940s, and two of those errors had no significant impact because the market remained in a sideways range without further depths.
While there are no absolute certainties in the market, it is encouraging to see that it continues to show classic signs of bullish momentum that support the previous signals we have discussed.
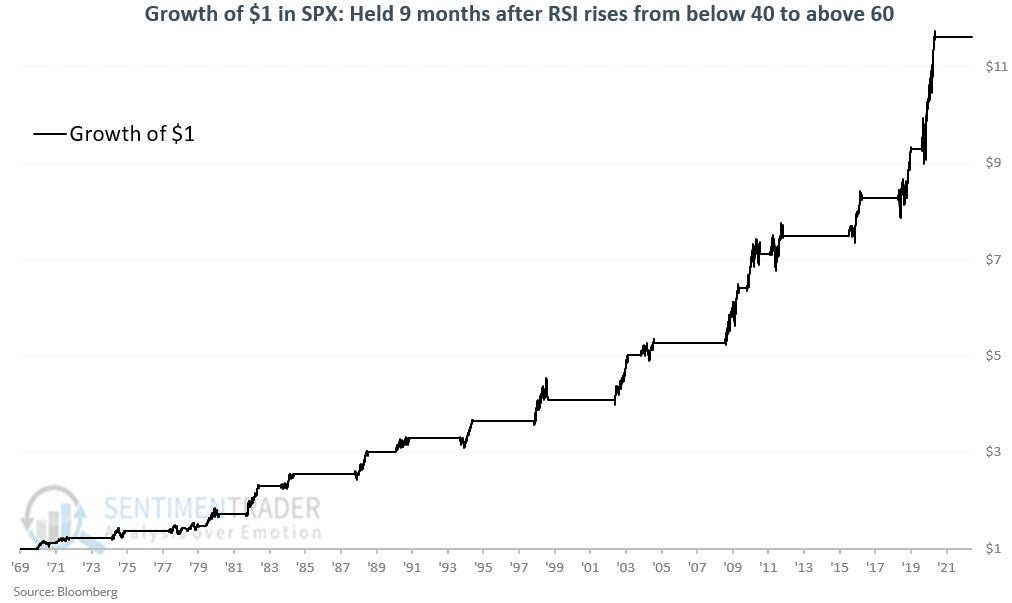
As shown in a chart provided by Sentiment Trader, these bullish phases of the market, where the RSI surpasses 60% after being below 40%, tend to be clearly bullish.
This analysis, combined with the other one, seems to indicate a completely bullish trend in the coming months.
This quantitative approach to observing the markets involves counting the occurrences of a specific event (in this case, overbought conditions) and analyzing what happens in the subsequent period. As we can observe, what is considered "overbought" generally leads to further overbought conditions, and that's how trends are generated.
However, in the market, many people do not observe medium-term trends and have an extremely short-term perspective, which leads them to consider overbought situations as dangerous. They think that the market has risen too quickly and, therefore, is bound to decline, as if the market had some kind of physical property where gravity pulls it down once it goes up.


